Maximize business profits by learning how to measure customer loyalty. Our guide walks you through the vital metrics, demonstrating their impact on brand success and customer retention.
January 18, 2024
Measuring Customer Loyalty: Essential Metrics for Brand Success
Question

We finally launched a loyalty program, but I can’t confidently say whether it is actually increasing retention and revenue —or whether our most loyal customers were just going to be loyal anyway.
What are the must-track loyalty metrics that will actually tell us whether the loyalty program is healthy and working?
Answer

Measuring loyalty requires a balance of non-financial signals — NPS, retention, transaction share, redemption behavior — and financial metrics like ARPU, loyalty uplift, and like-for-like comparisons. To get reliable results, track performance continuously over time against a well-matched control group.
Why is Measuring Customer Loyalty Important?
Gaining Insight into Loyalty Drivers
Understanding the importance of measuring customer loyalty begins with recognizing that loyalty is more than just repeat purchases — it encapsulates everything from customer satisfaction and preferences to engagement with your brand. In other words, this measurement goes beyond counting returning customers, seeking to understand the motivations and reasons behind their loyalty to the brand. By quantifying these aspects, businesses can tailor their marketing strategies and product offerings more effectively to meet consumer needs.
Financial Impact and ROI
The significance of measuring customer loyalty also lies in its direct impact on a brand’s financial health. Loyal customers typically contribute to a higher lifetime value, which translates into increased profitability over time. Effective analysis of loyalty metrics enables businesses to assess the return on investment for their customer retention efforts, helping them understand how these efforts contribute to overall revenue. This insight is particularly valuable in competitive markets where the cost of acquiring new customers often surpasses the cost of retaining existing ones by anywhere from five to 25 times.
Predictive Analysis for Future Trends
Finally, measuring the loyalty rate assists businesses in anticipating future buying patterns, adjusting to market trends, and making informed decisions on resource allocation. This foresight is invaluable for developing long-term strategies that not only maintain and strengthen customer relationships. For example, a noticeable increase in loyalty interactions could be an early indicator of a rising trend, prompting businesses to proactively capitalize on these insights by tailoring their product development and marketing strategies. On the other hand, a decline in loyalty engagement might be an early warning sign, signaling a need to reassess and realign offerings or communication strategies.
Non-Financial Customer Loyalty Metrics
Non-financial metrics offer insight into the effectiveness of loyalty programs, including the type of customer data provided, engagement drivers, purchase frequency, and bonus point usage. Let’s delve into more detail on each metric.
Data Richness
Getting at least a basic set of customer data is crucial for maintaining effective communication. A minimum dataset typically includes information customers are willing to provide after their first order: the customer’s full name, email, and phone number. This way, even if a customer unsubscribes from emails, you can still reach out to them via SMS.
Any additional data you collect depends on your business niche. For example, a children’s products store might collect data on children’s age ranges or interests to tailor their offerings, while a clothing store might focus on gathering information about preferred styles or sizes. This targeted data collection enhances the relevance and effectiveness of marketing efforts and product recommendations, making it a key component of customer relationship management.
Program Reach
This metric reflects the total number of loyalty program members. Tracking it can help gauge brand interest. However, focusing solely on reach can be misleading, and it should be analyzed along with other metrics. For instance, a growing member count can be encouraging, but it’s vital to discern active, purchasing members from those who have signed up but remain inactive or have not made any purchases. The presence of non-purchasing users might indicate opportunities to refine engagement strategies. Regularly updating the database to remove inactive contacts is critical for maintaining the accuracy and relevance of the data, ensuring that the loyalty program’s metrics genuinely reflect active customer engagement.
Moreover, it’s essential to contextualize program reach within the broader financial performance of the business. Taking United Colors of Benetton as an example, their 352,000 loyal customers generated about $2.7 million over 18 months. This revenue figure needs to be evaluated against the program’s scale to determine its effectiveness. Understanding the revenue contribution per member, and how it aligns with the company’s overall financial objectives, can provide a clearer picture of the loyalty program’s impact. This in-depth analysis is key to discerning whether the program is a significant revenue driver or if it requires strategic enhancements for better alignment with business goals
Net Promoter Score (NPS)
NPS is a type of customer loyalty score that assesses satisfaction via a simple one-question survey that is typically phrased as: “How likely is it that you would recommend our brand/service (s) to a friend or colleague?” Loyalty program members are asked to select a score from 1-10, where 1 = extremely unlikely and 10 = extremely likely to recommend.

Based on their scores, customers are sorted into three categories:
- Detractors (0-6)
- Passives (7-8)
- Promoters (9-10)
Tracking changes in NPS over time enables businesses to proactively address any potential issues and identify long-term trends in customer satisfaction and loyalty. This trend analysis is vital for strategic business planning and anticipating future market needs.
Take Tefal as an example: they conduct a survey post-delivery, asking customers to rate the service they received. Those who give low ratings (0-6) are contacted by the quality control department for feedback and resolution, while satisfied customers are encouraged to leave a review. This method is a key part of Tefal’s strategy to foster customer satisfaction and boost revenue.
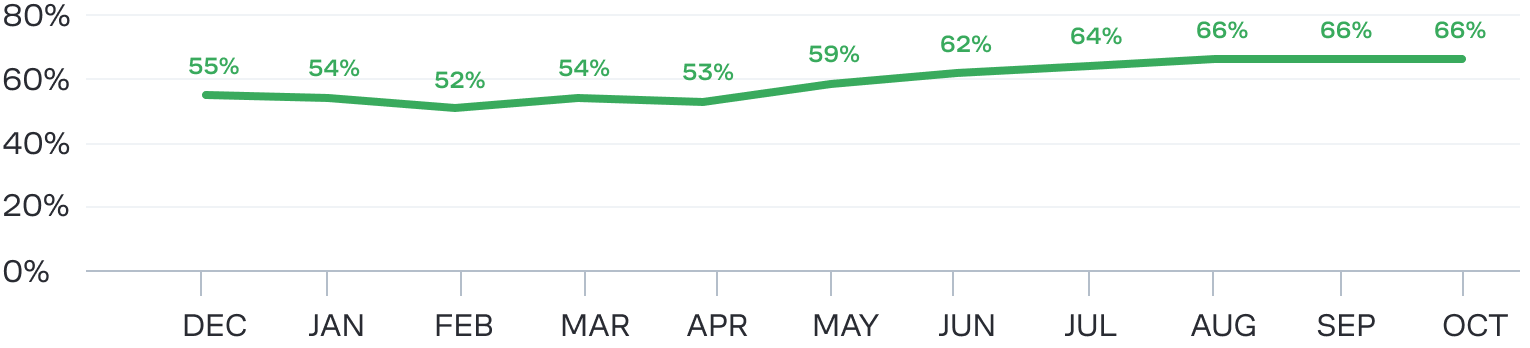
A chart depicting changes in Tefal’s NPS over the course of 11 months
Customer Loyalty Index
The Customer Loyalty Index (CLI) offers a comprehensive assessment of customer loyalty, going beyond the NPS focus on brand recommendation. Customer Loyalty Index surveys encompass a variety of aspects and typically include questions like:
- How likely are you to recommend our company to a friend/colleague?
- How likely are you to buy from our company again?
- How likely are you to try other products and services from us?

Loyalty members are asked to select a score from 1-6, where 1 = very likely and 6 = not unlikely. By aggregating these responses, the CLI provides a clear, numerical representation of loyalty levels. This index allows business to pinpoint areas needing improvement and to identify the factors that most significantly influence customer loyalty.
Customer Acquisition and Retention
It’s essential not only to focus on attracting customers to your loyalty program, but also on retaining them. Without measuring your retention rate, there’s a risk that money spent on acquisition is wasted: customers may register for your loyalty program but never make purchases or open emails.
The customer retention rate (CRR) is measured using the following formula:
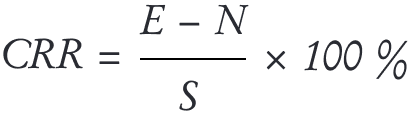
E = number of customers at the end of the selected period.
N = number of new customers acquired during the period.
S = number of customers at the beginning of the period.
N = number of new customers acquired during the period.
S = number of customers at the beginning of the period.
For example, an online footwear retailer initially had 1.000 loyalty program members (S). Over the course of a month, 150 new members joined (N), but 200 customers left, leaving 950 members by the month’s end (E).
The CRR for the month can be calculated as follows:
(950 − 150) ÷ 1.000 × 100% = 80%
(950 − 150) ÷ 1.000 × 100% = 80%
This means the brand’s loyalty program retention rate stands at 80%. This suggests that the loyalty program is doing well in keeping members, as industry benchmarks often consider 70-90% to be healthy. However, the loss of 200 members also indicates there’s room for improvement. It’s vital to investigate why these customers left and develop strategies to address these issues. Was it a lack of engaging content, insufficient rewards, or something more fundamental about the product or service?
Loyalty Program Transaction Share
This metric shows the percentage of revenue that comes from loyalty program members — the program might have a million members, but this will not be beneficial if they don’t contribute to a brand’s revenue. An increasing transaction share is an indicator that the company is attracting the right audience. This is typically calculated using the following formula:

For instance, clothing retailer Charuel typically sees about 70% of its transactions from loyal customers. Sometimes, during sale periods, this drops to 60%, but for Charuel, it’s not a cause for alarm — the company continuously monitors the transaction share and understands that a drop doesn’t necessarily mean that program members are buying less. One reason for this is that during sale periods, not all customers use their loyalty cards as accumulated points cannot be applied to discounted items.
Redemption Rate
The redemption rate reflects how efficiently customers are using the bonus points they’ve earned. Failing to track this metric means missing out on whether customers are carrying out the target action (i.e., spending points). The redemption rate can be calculated as follows:
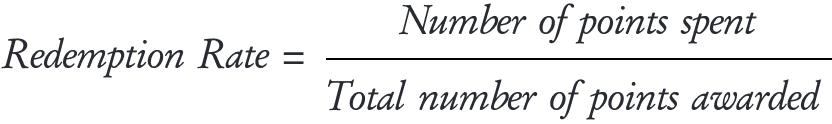
If a retailer wants customers to return for a repeat purchase within two months, one approach would be to award bonus points that expire by a specific date. The brand would then need to monitor how many customers utilize these points to determine the redemption rate.
Financial Customer Loyalty Metrics
Financial metrics help determine how much revenue a loyalty program brings to a company. There’s no universal method for measuring these metrics, but two main approaches are commonly used:
- Comparing the company’s financial metrics before and after the implementation of the loyalty program.
- Comparing the income generated from loyalty program members with that from non-members during the same period.
Let’s dive into more detail on each of these methods.
Comparing Company Financial Metrics Before and After Program Implementation
At Maestra, we lean towards this approach and consider it more precise — however, it comes with its own set of drawbacks that must be taken into account.
Year-Over-Year (YOY), Month-Over-Month (MOM), and Week-Over-Week (WOW) Like-for-Like Metrics
This involves comparing the same metrics over equivalent periods, such as 2019 versus 2020, or April 2021 versus May 2021. Analyzing revenue, profits, or the number of transactions from loyalty program participants over these periods reveals overarching trends — whether the metrics are trending upwards or downwards.
Drawback: Differentiating the impact of various factors can be challenging. For example, expanding product lines, opening new stores, or broader political and economic shifts can also influence revenue changes. Consequently, attributing these changes solely to the loyalty program’s effectiveness might lead to incorrect conclusions.
For example, consider an online store that launched a loyalty program during an economic downturn. This resulted in a reduced average order value (AOV) and fewer repeat purchases. However, as the economic situation improved over the year, a comparative analysis showed an increase in transactions and revenue. In this case, it’s unclear whether this increase was due to the loyalty program or the economic upturn.
Regional or City Comparisons
This method involves selectively rolling out the loyalty program in specific regions or cities and withholding it from others to evaluate its impact on revenue. This approach can be particularly revealing for businesses with a diverse geographic footprint, as it allows for a comparative analysis of market-specific customer behavior and program effectiveness.
Different regions may have varying levels of market maturity, customer preferences, and competitive landscapes. Comparing the performance of a loyalty program across these different settings provides insights into how regional nuances affect customer engagement. This knowledge can inform more localized marketing strategies, ensuring that efforts are tailored to the unique characteristics of each market.
Drawback: The downside here is the cost and complexity involved. For example, it may be difficult to find a city like New York for a fair comparison in terms of customer income and average spend.
Changes in Customer Cohort Behavior
Online stores collect customer data even without a loyalty program, as it’s needed for order fulfillment. When a store launches a loyalty program, some customers from the existing database might join and start accumulating bonuses. These customers can be compared: the revenue they generated before and after joining the program.
Drawback: There may be insufficient data for a reliable assessment. For instance, if only a hundred customers from the old database register for the loyalty program, that number is too low to draw accurate conclusions.
Comparing Revenue Between Loyalty Program Members and Non-Members
This is the second approach to measuring the financial metrics of a loyalty program.
Brands like Burger King and 12 Storeez use a metric called “loyalty uplift” to gauge the efficacy of loyalty programs — this reflects the increase in revenue attributable to the loyalty program within a specified timeframe.
The following formula is used to calculate the loyalty uplift:
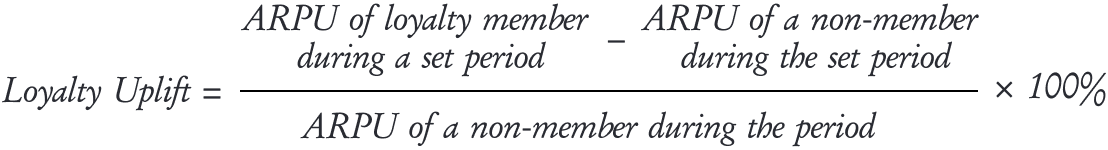
ARPU refers to the average revenue per user (loyalty member) over a certain period. The period should be selected based on the brand’s sales cycle and purchase frequency. For example, for a company with a one-month sales cycle, it’s better to calculate the uplift over a year to gather more information on customer revenue.
For example, if the annual ARPU of a loyalty program member at a jewelry store was $2,300, and $1,500 for a non-member, the loyalty uplift would be calculated as follows:
((2,300-1,500) ÷ 1,500) × 100% = 53.3%
((2,300-1,500) ÷ 1,500) × 100% = 53.3%
In this case, the jewelry store’s loyalty uplift would stand at 53.3%, indicating that participants of the loyalty program contribute more to the revenue than non-participants.
Drawback: There’s a danger of misinterpreting causation — it’s not necessarily the loyalty program that makes users more active. Instead, it may be that the users that tend to sign up for the program are more active to begin with.
In other words, the apparent success of the loyalty program may not stem from its inherent effectiveness, but because it’s joined by engaged customers seeking better purchasing deals. Conversely, a customer who doesn’t anticipate returning to the store is less likely to enroll in the program, preferring not to invest time or share personal information without benefit.
Measuring Customer Loyalty: Top Three Recommendations From Maestra’s Analysts
- Continuous Evaluation: To ensure your loyalty program’s continuous improvement, establish routine assessments of its key performance indicators. This means setting up a dashboard or a reporting system that tracks customer engagement, redemption rates, and incremental revenue from loyalty members. Use this data to conduct monthly or quarterly reviews and adapt your strategies in real time. For example, if you notice a decrease in engagement, you might need to refresh the rewards offered or communicate more effectively about the benefits of the program.
- Select an Appropriate Control Group: Choosing an ill-matched control group for comparison can lead to under- or overstated loyalty program revenues. For example, comparing loyalty program members who buy high-end electronics to non-members who purchase discounted supplies or accessories would not be appropriate, as the spending patterns are inherently different — the former group’s spending is likely to be higher. To create a good control group, identify customers who closely match your loyalty members in demographics, purchase history, and behavior but are not enrolled in the program. Marketing platforms like Maestra can help segment these groups based on specified criteria. By comparing the loyalty program members against this control group, you can isolate the effect of the loyalty program on customer behavior and spending.
- Monitor Metrics Over Time: To get an accurate picture of your loyalty program’s impact over time, set up a system that tracks customer behavior across different periods. This could involve creating customer segments in your database and using analytics tools to monitor their interactions and transactions with your brand over months or years. This approach allows for a more nuanced understanding of loyalty patterns and can highlight when particular strategies are successful or when they may need to be adjusted. For instance, if you observe a dip in loyalty program performance post-Christmas, you could consider implementing off-season promotions to maintain customer engagement.
Consider this example from a major retailer with an annual sales cycle. Analysts measuring loyalty program metrics in January encountered conflicting information. Despite a high Net Promoter Score, loyalty program participants' Average Revenue Per User (ARPU) was lower than that of non-members, and there was a low response to marketing initiatives. The initial analysis suggested poor advertising performance. However, the company’s CRM strategist recommended they maintain the current strategy and continue tracking metrics throughout the year. Subsequent months showed an increase in ARPU, culminating in a 34% increase by the end of the year, which demonstrated the loyalty program’s robust impact over time.
Comparing long-term metric changes provides a more objective view of data trends.

In the first month, the ARPU growth of the loyalty program participant was lower than that of the control group. By the end of the year, the ARPU growth exceeded 30%
Final Thoughts
Diving into customer loyalty metrics like NPS, ARPU and CLI is about much more than numbers — it’s about gaining a deeper understanding of your customers identifying ways to enhance their experiences. The key to a successful loyalty program lies in how you leverage these insights to foster stronger relationships, whether through improved communication or a more personalized shopping experience. Ultimately, this focused approach not only enriches the customer experience but also results in a positive impact on your ROI.