Explore how INCANTO achieved a 519% ROI using Maestra, with email campaigns generating 19% of their online revenue and product recommendations increasing sales by 5.5%. Learn more.
INCANTO: An Impressive 519% ROI on Marketing Automation — and That’s not Counting Additional Revenue from Product Recommendations
Incanto — is an Italian manufacturer of underwear and beachwear. The brand has an online store and over 100 thousand customers in the CIS.
Thanks to product recommendations, INCANTO increased its total revenue by 5.5% (relative to the control group), and the email channel began generating up to 19% of the online store’s total revenue, with an ROI of 519% from Maestra. In this story, we’ll be sharing statistically significant results of some A/B tests and feedback from the director of e-commerce at INCANTO, Andrey Lebedinsky.
Key figures
-
up to 19%of the total monthly revenue of the online store is generated by email newsletters
-
5.5%of monthly revenue is generated by product recommendations on the website
-
519%ROI from Maestra
Results
Two indicators are used to measure the results of working with Maestra:
- The share of revenue generated by emails relative to the total revenue of the online store.
- Additional revenue from website product recommendations relative to the control group.
Based on the profitability indicators of the email channel and the revenue from recommendations, we calculated the ROI obtained by Incanto from Maestra.
Revenue from product recommendations on the website relative to the control group
To measure the effectiveness of product recommendations on the site, we set up a control group. Half of the visitors to the INCANTO website fell into the main group and saw product recommendations, the second half was put in the control group and were not shown product recommendations.
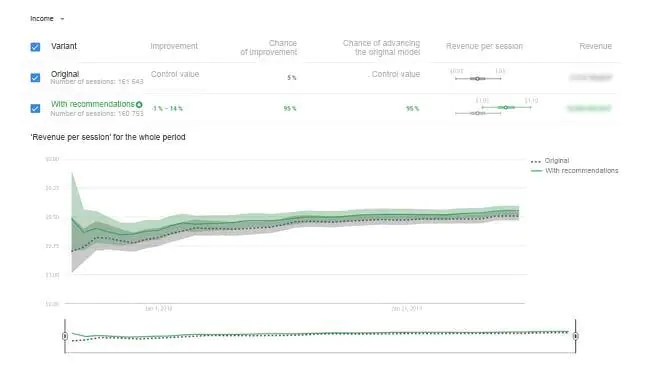
We measured the difference between the two groups after 2 months. According to the results, visitors who saw product recommendations brought in 5.5% more revenue with a statistically significant probability of 95%. At INCANTO’s request, we are unable to disclose exact figures. In the screenshot below, you can see that the value of a control group session is $0.95-1.05, while for the main group, who were displayed product recommendations, it was $1.05 — $1.10.

Revenue data from Google Optimize
Share of revenue from email campaigns relative to the online store’s total revenue
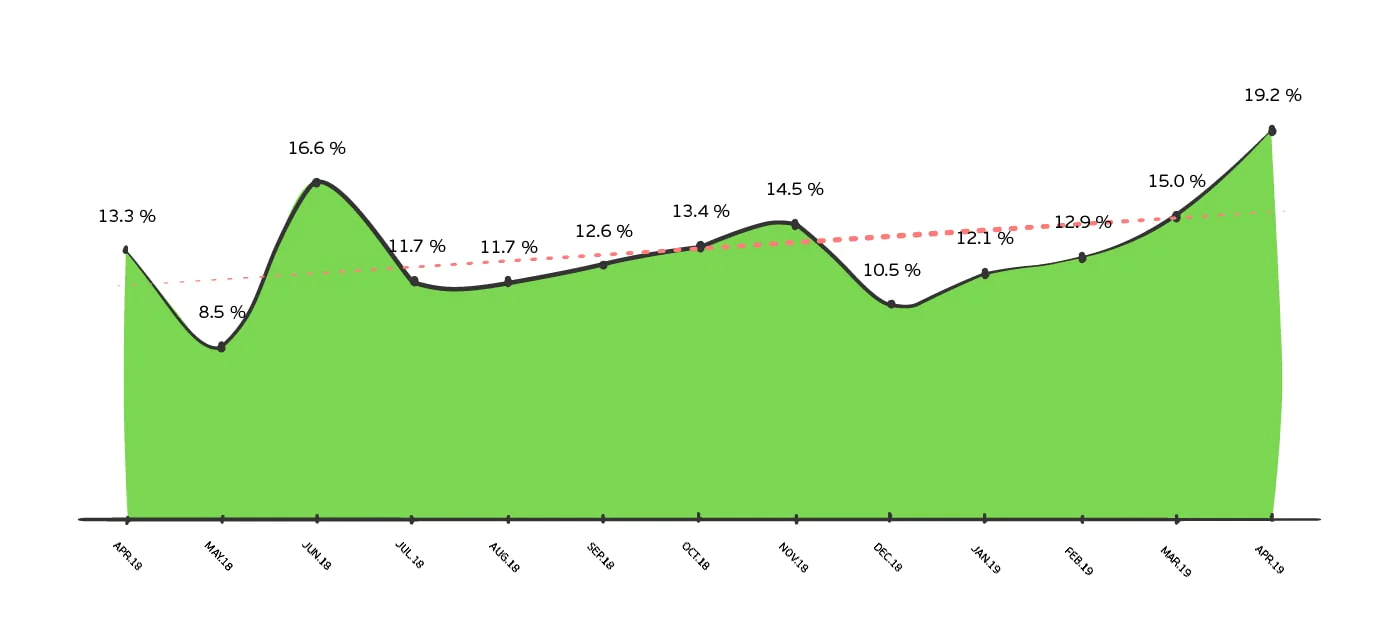
On average, the monthly share of revenue from newsletters relative to the total revenue of the online store increased from 12% to 15% (data from Google Analytics, based on the last click attribution method). As you can see in the graph below, during the wintertime, sales decline and then begin to increase by summer.
Revenue of the email channel relative the total revenue of the online store
ROI from Maestra
We calculated the ROI from INCANTO’s Maestra implementation. To calculate this, we took figures from June 2018 to June 2019:
- Margin of orders from the email channel based on last touch attribution.
- Maestra subscription price, excluding VAT.
The client requested that we do not disclose exact figures in this publication. The formula is as follows:
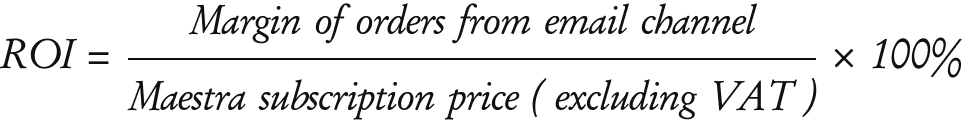
INCANTO’s ROI from Maestra equates to 519%. Every $1 invested in the platform brought the client $5.19 of additional revenue — this is without taking into account the revenue generated by product recommendations on the website.Andrey Lebedinsky, Director of e-commerce at INCANTO

Maestra is an excellent tool that allows you to quickly launch effective communications with customers. All communication channels, product recommendation algorithms, and personalization can be accessed in a single platform and with proven efficiency. Platform is updates take our feedback into account, the integrations are simple and clear, we have received no complaints regarding the interface from our email marketer.
I would also like to mention the excellent customer support, it is always prompt and fulfills all of our queries.
Maestra opens up so many opportunities for effective communications with our customers — so much so that we likely don’t even use half of them. Nonetheless, we will accelerate further and increase the number of newsletters, recommendations and personalizations in the store’s arsenal.
INCANTO’s goals
Prior to migrating over onto Maestra, INCANTO used a different platform to send manual and one-off automated campaigns. There were no product recommendations on the website or in email newsletters. The brand approached Maestra to help achieve a number of key goals:
- Increase the share of the email channel in the scope of the online store’s total revenue.
- Install product recommendations on the website and increase the conversion rate in product cards.
- Connect new communication channels for single-window mode operations.
Tasks
Based on the situation at hand, we identified several tasks:
- Add product recommendations to the website and test them with a control group.
- Automate email communications.
- Improve the performance of automated campaigns with the help of A/B tests.
We will go over each task in further detail below.
Launching product recommendations on the website
Hypothesis
Customers will make purchases more often if they see useful recommendations in product cards. On the INCANTO website, product collections are generated according to a personal recommendation algorithm: we recommend products that are viewed and purchased by customers who demonstrate similar behavioral characteristics to one another.

An example of a product card with personalized recommendations
Website option versions
To measure the revenue from product recommendations on the website, we set up an experiment through Google Optimize: 50% of the site’s visitors belonged to the main group, and were exposed to product recommendations on the site and on product pages, the other 50% visitors landed in the control group and did not see product recommendations.
Test results
Our hypothesis was confirmed. The differences are statistically significant, with a confidence level of 95%. We saw a big difference in sales around 3 months into the experiment — product recommendations in product cards brought in 5.5% extra revenue for the online store relative to the control group. In the screenshot below, you can see that the value of the control group session is $0.95-1.05, while in the main group, which saw product recommendations, it comes out to $1.05 — $1.10.
Revenue data from Google Optimize
How email communication was automated
In total, 11 automated campaigns were launched in a year. Among them were:
- Subscriptions for back in stock notifications
- Abandoned cart
- Next purchase recommendations
- An NPS survey
Let’s take a closer look at the two communication workflows with the highest conversion rates: back in stock notifications and abandoned cart.
Back in stock subscription
If a customer is interested in a product that is currently out of stock, he can subscribe to receive a notification when the product is available again. The email sequence consists of two campaigns. The first email is sent if the product has not been restocked within a week after the customer subscribed. The second email is sent when the product is back in stock.
The first email contains recommendations for similar products if the initial item has not yet been restocked
If the product is not available in a week’s time, we will send a selection of popular items that are currently available based on similar product characteristics.
The second email is sent as soon as the item is back in stock again
The second letter is transactional — it is sent regardless of subscription status. It notifies the customer that a product they subscribed to is back in stock and available for purchase. As this email campaign has only recently been launched, we don’t yet have any stats on its performance.
Campaign
Open rate
Click rate
Conversion rate
Average order value
Recommendations of similar popular products
61.7%
18.5%
0.203%
$76

Example of a campaign with product recommendations
Abandoned shopping cart
The abandoned shopping cart email sequence is launched if a customer has added items to their cart but did not complete their purchase. The sequence consists of three emails, the first of which is sent within thirty minutes after cart abandonment. After this an email with a promotional code and an email with a reminder about said code are sent, but only if the client has not placed an order within a week.
In the abandoned shopping cart sequence, we suggest recommended products that are similar to ones that were added to the cart.


Campaign
Open rate
Click rate
Conversion
Average order value
First email with the abandoned cart contents
39.6%
12.9%
0.357%
$90
Second email with a promo code
13%
12.9%
0.499%
$87
Third email with a reminder about the promo code
47.1%
14.7%
0.528%
$93
To increase conversion statistics for automated campaigns, we launched some A/B tests. Here is some more detail on two of them.
Test # 1: Bestsellers with a discount
Hypothesis
If a “Go to the website” button is added to the automated campaign with discounted bestselling items, customers will be more inclined to visit the website. Thus, the CTR (click-through rate) will increase.
Campaign variants
There were two options — one with a “Go to the website” button and one without.

A campaign with a “Go to the website” button
Test results
The hypothesis was confirmed. The differences are statistically significant, with a confidence level of 95%.
Campaign variant
Click rate
With the “Go to website” button
4.4%
No button
3.7%
The difference in clicks was 0.7%. Thus, adding an extra button that allows recipients to visit the website increases the CTR by ~20%.
Test # 2: Abandoned shopping cart campaign call to action
Hypothesis
Customers will open emails more often if they see a call to action in the subject line.
Campaign variants
There were two variants of the subject line:
- “Not ready to purchase yet?”
- “Not Ready to purchase yet? Better hurry!”

An example of an abandoned shopping cart campaign
Test results
The hypothesis was confirmed. The open rate for campaigns with a call-to-action in the subject line was higher with a statistically significant difference.
Campaign variant
Open rate
“Not ready to purchase yet?”
38.05%
“Not ready to purchase yet? Better hurry!”
39.82%
The difference in the open rates was 1.77%. Thus, a call to action increases the open rate by approximately 5%.
Conclusion
Over the last year, we launched 11 automated campaigns and conducted a series of A/B tests to improve performance. The monthly revenue generated by the email channel grew by 3% on average, according to Google Analytics. We installed a product recommendations widget on the website, which increased the monthly revenue by $11,500 relative to the control group.
The next step is to launch web push campaigns and integrate Maestra with the INCANTO mobile application when it is launched.